Background: Cevostamab is an FcRH5 (Fc receptor-homolog 5) targeted T cell-dependent bispecific (TDB) currently being evaluated in the clinic, with promising activity and favorable safety profile as a monotherapy in patients (pts) with heavily pre-treated Relapsed/Refractory multiple myeloma (MM) (NCT03275103, Trudel et al. ASH 2021). Cevostamab selectively engages and activates T cells in the proximity of MM cells in the bone marrow (BM) to drive tumor cell killing. To dissect the transcriptional and functional impact of cevostamab treatment on the MM BM tumor microenvironment (TME) and identify factors linked to enhanced killing, we established an ex vivo TDB killing assay with MM pt BMMC (BM mononuclear cells) samples followed by detailed characterization of immune and tumor cells.
Methods: We tested commercially procured frozen BMMC samples from 7 pts with Stage I or Stage III Newly Diagnosed Multiple Myeloma (NDMM) with no known prior treatments (except a paired, longitudinally collected sample) and median age of 67.5 years. BMMC samples containing endogenous T and MM cells were treated ex vivo with 10 ug/mL of either a non-targeted TDB (considered as baseline) or a research grade cevostamab surrogate (FcRH5 TDB) for 16 to 48 hours (hr). T cell enumeration and MM killing (CD138 + CD38 +) was evaluated at 48 hours by flow cytometry. Ex vivo response was normalized by T cell quantity and defined as % tumor cell killing per 10 3 T cells present in the assay, which was used to classify samples as Responders (R) (>= 10%) or Suboptimal Responders (SoR) (< 10%). Single cell RNA-seq (scRNA-seq) was performed at 16, 24 and 48 hr post treatment. Tumor-specific genes enriched in SoRs at baseline were investigated for prognostic value by examining their bulk gene expression profile in baseline tumor samples (CD138-enriched) from pts (N=1150) treated with immunomodulatory drug, proteasome inhibitors, or combinations thereof (NCT01454297, MMRF CoMMpass IA22).
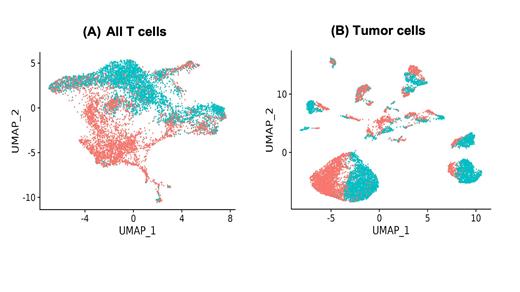
Results: We first examined the T cell compartment by scRNA-seq profiling. Upon FcRH5 TDB treatment, clustering analysis suggested that CD4 and CD8 T cells undergo extensive transcriptional changes compared to control TDB (Fig 1A). A TNF and LTA-expressing CD4 memory cluster was enriched upon treatment in both SoRs and Rs, but to a greater extent in Rs. A similar trend was observed with an IFNG and CCL4-enriched CD8 effector-like proliferating T cell cluster.
Transcriptional profiles of MM cells suggested inter- and intra-pt tumor heterogeneity at baseline. MM cells in SoRs at baseline had higher expression of genes like CD44, SRGN, CCND2 and SLAMF1. Of these genes, higher expression of CD44 or SRGN was found to be significantly associated with worse outcome to 1L treatments. Exposure to FcRH5 TDB altered tumor cells from all pts (Figure 1B), resulting in significant upregulation of genes such as HLA-E, SOCS1, and TNFSF10. Increase in CXCL9 expression upon treatment was found to be higher in Rs than SoRs.
Discussion: Our work provides a novel ex vivo approach for unbiased, high dimensional pharmacodynamic profiling of functional and transcriptomic changes in pt samples by combining TDB treatment with scRNA-seq. Consistent with the expected mechanism of action and preliminary biomarker analysis reported for cevostamab (Nakamura et al. ASH 2020), FcRH5 TDB led to increased expression of genes in T cells associated with infiltration, activation and effector function. It also induced transcriptional changes in MM cells regardless of the ex vivo response status, including upregulation of genes associated with T and NK cell infiltration and antigen presentation. For certain genes, a greater magnitude of these changes was observed in Rs. These identified genes, and enriched clusters will be examined in clinical RNAseq data from cevostamab-treated pts. It remains to be determined whether our results reflect treatment effects that are applicable to other targeted bispecifics in MM. Overall, our assay setup can serve as a platform to generate novel hypotheses, corroborate clinical observations, identify pt-specific features driving improved or dampened response, and test novel combinations for improved killing.
Figure 1 : UMAP (Uniform Manifold Approximation and Projection) plot of all (A) T cells and (B) tumor cells shows distinct clustering of cells by treatment type for all pts (red: FcRH5 TDB; blue: non-targeted TDB)
Disclosures
Roy:Genentech, Inc.: Current Employment, Current equity holder in publicly-traded company; Amgen Inc: Current equity holder in publicly-traded company, Ended employment in the past 24 months. Del Cid:Genentech, Inc., F. Hoffmann-La Roche Ltd: Current Employment. Lu:Genentech, Inc., F. Hoffmann-La Roche Ltd: Current Employment, Current equity holder in publicly-traded company. Diaz:Genentech, Inc., F. Hoffmann-La Roche Ltd: Current Employment, Current equity holder in publicly-traded company. Palencia:Teva Pharmaceuticals: Ended employment in the past 24 months; Genentech, Inc.: Current Employment. Nakamura:Genentech, Inc., F. Hoffmann-La Roche Ltd: Current Employment, Current equity holder in publicly-traded company. Bolen:Genentech, Inc.: Current Employment; F Hoffmann-La Roche Ltd: Current equity holder in publicly-traded company. Hatzi:Genentech, Inc., F. Hoffmann-La Roche Ltd: Current Employment, Current equity holder in publicly-traded company.


